Executive Summary
 Nearly every trip begins on a city street or county road. Whether traveling by bicycle, bus, rail, truck or family automobile, Californians need a reliable and well-maintained local street and road system. Every component of California’s transportation system is critical to providing a seamless, interconnected system that supports the traveling public and economic vitality throughout the state. Sustainable communities cannot function without a well-maintained local street and road system that provides access for transit and active modes of transportation like bicycling and walking. The first comprehensive statewide study of California’s local street and road system in 2008 provided critical information and analysis of the local transportation network’s condition and funding needs. Each subsequent report has monitored the changes biennially. This study sought answers to important questions: What are the current pavement conditions of local streets and roads? What will it cost to repair all streets and roads? What measures are necessary for a system to function safely? What is the impact of the additional funding available from the Road Repair and Accountability Act of 2017 (SB 1) on the condition of local streets and roads, bridges, and essential components?
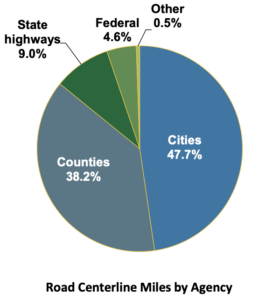
Responsible for over 85 percent of California’s roads, cities and counties find the continuation of this study to be of critical importance for several reasons. Its results continue to educate policymakers at all levels of government and the public about the infrastructure investments needed to provide California with a seamless, multi-modal transportation system. Its findings provide a credible and defensible analysis to support a dedicated, stable funding source for local system maintenance. It also provides the rationale for the most effective and efficient investment of public funds, potentially saving taxpayers from paying significantly more to fix local streets and roads into the future.
 Previous editions of this report cautioned that without an influx of new revenues, the vital local street and road system would continue to deteriorate and cost taxpayers increasingly more to repair. After years of careful consideration and study, the Legislature passed and Governor Jerry Brown signed SB 1 in 2017. The passage of SB 1 was a significant success for municipal governments statewide and injected a long-awaited substantial infusion of funding to maintain local street and road systems. The bill provides over $5 billion annually for transportation, and of this, approximately $1.5 billion is allocated to the local street and road system owned and maintained by 539 cities and counties. Despite the passage of SB 1 in 2017, there was considerable uncertainty surrounding local transportation funding through 2022 due first to the effort to repeal SB 1 in November 2018, and then to the COVID19 pandemic in early 2020. The former created a climate of uncertainty where cities and counties were reluctant to commit to long-term repair efforts, and the latter resulted in significant revenue reductions and uncertainty through the 2022 construction season. Both of these events impacted local government transportation project delivery between 2018 to 2022. As with previous updates, this 2022 update surveyed all of California’s 539 cities and counties. Almost 70 percent of the agencies that were solicited responded – a level of participation that makes clear the sustained interest in addressing the growing problems of crumbling local streets and roads.